ELEC3203 · Digital Coding & TransmissionInformation Theory Fundamentals
Information Theory · Lecture notesProf. Celik
ELEC3203 · Digital Coding and Transmission
Lecture 1
Information, Entropy and the Digital Source
How much information does a message actually carry, and what is the smallest number of bits we truly need in order to send it? This lecture builds the answer from first principles.
Learning Objectives
Explain the anatomy of a digital communication system (Tx, channel, Rx) and where information theory fits
Compute the self-information and entropy of a discrete memoryless source
Calculate a source’s information rate and explain why fixed-length BCD coding wastes bandwidth
Claude E. Shannon (1916–2001) was an American mathematician and electrical engineer at Bell Labs and MIT. His 1937 master’s thesis showed that Boolean algebra could describe switching circuits, the basis of digital logic, and his 1948 paper A Mathematical Theory of Communication founded information theory: the bit, entropy and channel capacity that this module builds on.
“I visualize a time when we will be to robots what dogs are to humans, and I am rooting for the machines.” — Claude Shannon
1.1 A primer on digital communication systems
The whole module in miniature — transmitter, channel, receiver, and the resources they trade
The aim of any telecommunication system is to convey information between two locations that are separated in space, over a channel of adequate quality, at a certain rate and reliably.
Figure 1.1. The basic communication system model: a transmitter sends a signal through a channel to a receiver, with noise and distortion entering along the way.
Resources spent
Power
Time
Bandwidth
Space
KPIs targeted
Rate
Latency
Reliability
Energy eff.
This picture is the whole module in miniature. The channel offers a fixed set of resources — transmit power, time, and bandwidth (and, in multi-antenna systems, space) — and the job of the transmitter and receiver design is to spend those resources so as to hit the best possible key performance indicators (KPIs): information rate (how many bits per second get through), latency (how long it takes), reliability (how rarely errors slip past), and energy efficiency (how many bits per joule). Every technique in this module, from source coding to channel coding to modulation, is really a way of trading these resources for these KPIs.
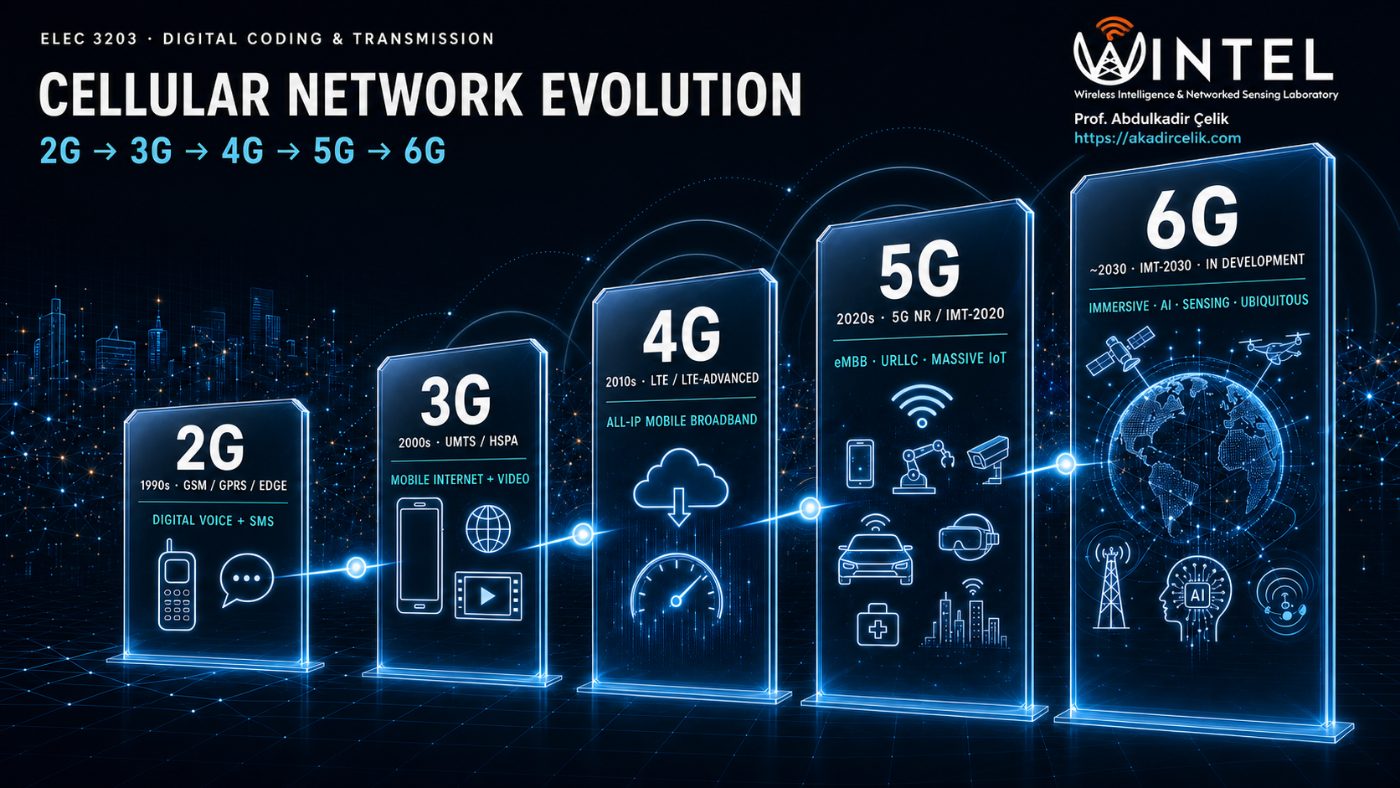
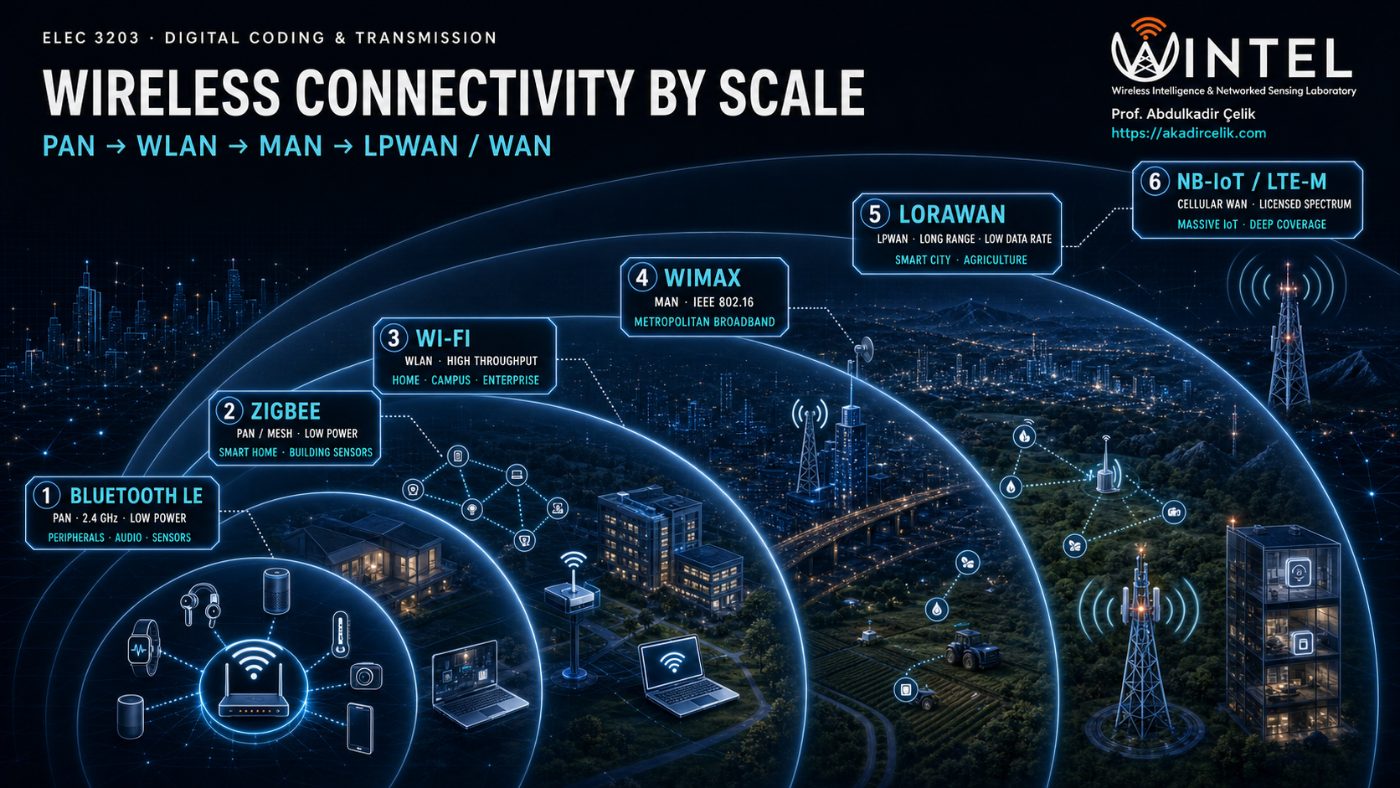
In practice there is no single "best" wireless technology — different applications sit at different points on the resource/KPI trade-off, so the wireless landscape has evolved into a family of standards, each tuned to a different range, data rate, power budget, and device density. Cellular networks (2G–6G) have progressively traded new spectrum and complexity for higher rate, lower latency, and support for ever more connected devices, while short- and medium-range technologies (Bluetooth LE, Zigbee, Wi-Fi, WiMAX, LoRaWAN, NB-IoT) each cover a different rung of the range/power/throughput ladder, from a wrist-worn sensor a few metres away to a smart-city meter kilometres from its gateway.
Figure 1.2. Left: the cellular generations, each adding capability for new use cases. Right: wireless technologies organised by coverage range, from personal-area to wide-area networks.
Because the whole module is digital, we first look at how a real source becomes a stream of bits, and then place that stream in the full system.
An analogue source such as speech or video is not digital to begin with. It is turned into a stream of bits by two steps:
Sampling. Measure the waveform at regular instants. The Nyquist rule says we must sample at least twice as often as the highest frequency present, otherwise information is lost through aliasing.
Ωs = 3.00 ΩM
Figure 1.3. Effect in the frequency domain of sampling in the time domain. (a) Spectrum of the original signal, band-limited to \(\Omega_M\). (b) Spectrum of the sampling function, impulses spaced by the sampling frequency \(\Omega_s\). (c) Spectrum of the sampled signal: copies of (a) centred on every impulse, with the ideal reconstruction filter \(|\Omega|<\Omega_s/2\) dashed. (d) What the filter recovers, against the original (dashed). (e) The same result in time: the original signal \(x_c(t)\), its samples, and the reconstruction \(x_r(t)\) built from those samples. Drag the slider or press Sweep: with \(\Omega_s>2\Omega_M\) the copies stay apart, (d) matches (a) and \(x_r(t)=x_c(t)\); with \(\Omega_s<2\Omega_M\) they overlap, and \(x_r(t)\) departs from \(x_c(t)\) between the samples. After Oppenheim & Willsky, Fig. 7.3.
Quantisation. Round each sample to one of a finite set of levels. Rounding cannot be undone, so it introduces quantisation noise.
Press Play to follow the signal down the pipeline.
Figure 1.4. Following the signal down the pipeline: the analogue input is continuous, sampling reads its value at regular instants (the dots), quantisation snaps each of those values to the nearest allowed level (the staircase), and encoding labels each level with a binary code word. Sampling can be exact if the Nyquist rule is met, but quantisation always throws a little away, and that loss appears as quantisation noise.
With the source reduced to a clean stream of bits, we can place it in the full communication system. A generic digital transmission scheme is a chain of building blocks, with the transmitter along the top, the channel on the right, and the receiver returning along the bottom.
Press Play to follow one message from input to output.
Figure 1.5.Vertical grouping splits the blocks into three jobs. The CODEC (blue) handles source and channel coding, the MODEM (amber) handles modulation and demodulation, and the channel is the transmission medium. Modulation and demodulation sit in the same column so the MODEM pair lines up. Horizontal grouping separates transmitter (top) from receiver (bottom). A CODEC and MODEM pair on each side together forms a transceiver, for example the radio inside your phone. The strip under the diagram shows the data in transit at each stage: source symbols, compressed bits, bits with parity added, the modulated waveform, the noisy received waveform, and the recovered bits.
What each block does
Source coding
Squeezes the message down by removing redundancy, so it uses as few bits as possible, ideally close to the entropy \(H\). Examples: Huffman or ZIP for text, JPEG for images, MP3 for audio.
Channel coding
Adds a controlled amount of redundancy back in, so the receiver can detect and correct the errors that noise introduces. It deliberately works against source coding. Examples: parity and Hamming codes, convolutional, turbo and LDPC codes.
Modulation and demodulation
Maps the bit stream onto a physical waveform that suits the medium, such as a voltage level, a radio carrier, or a light pulse. The demodulator recovers the bits at the far end. Examples: ASK, FSK, PSK, QAM, OFDM.
Channel
The physical medium the waveform travels through, for example copper wire, optical fibre, or free space radio. It is never perfect: it weakens the signal and adds noise, and that is what ultimately limits the rate.
Reading left to right: source coding makes the stream small, channel coding makes it robust, and modulation makes it physical. The receiver simply undoes each step in reverse order.
Looking ahead · joint source-channel coding
Treating source coding and channel coding as two separate, independently optimised blocks is convenient and, for a single point-to-point link with an ideal infinite-length code, provably lossless in the limit (Shannon's separation theorem). But real transceivers do not enjoy infinite code length or a fixed, known channel, so joint source-channel coding (JSCC) — designing the two stages together, or replacing them with a single learned mapping from source symbols straight to channel symbols — is increasingly the standard rather than the exception in modern wireless systems, because it can adapt gracefully to unpredictable channel quality where separate coding fails abruptly.
This is also where AI enters the transceiver: deep learning-based JSCC (e.g. autoencoder-style neural encoders/decoders) learns the source-to-channel mapping directly from data, degrading gracefully as channel conditions worsen instead of hitting the "cliff effect" of classical separated designs, and underpins emerging semantic and task-oriented communication schemes being explored for 6G.
Figure 1.6. A deep JSCC autoencoder (schematic). The encoder maps 8 source values straight to 3 channel symbols, compressing and channel-coding in one step. The channel adds noise, and the decoder maps the received symbols back to an estimate \(\hat{x}\). Training compares \(\hat{x}\) with \(x\) and backpropagates the error through decoder, channel and encoder, so both halves learn together. The values and loss are illustrative, not a trained result.
This lecture concentrates on the very first block, the source, and asks the most basic question of the whole field. What is information, and how do we measure it?
Shannon's theorem: the destination
If the information rate of a source does not exceed the capacity of a channel, then there exists a coding scheme that transmits the information over that channel with an arbitrarily small probability of error, despite the noise. If the rate exceeds capacity, no coding scheme can save you. The whole theorem compresses into one inequality relating the source's information rate \(R\) to the channel's capacity \(C\):
$$ R \le C \quad\Longrightarrow\quad \text{reliable transmission is possible.} $$
(1.1)
This is an existence result. It promises that a code exists once \(R \le C\), but it does not tell us how to build one, and it says nothing about delay or complexity. Reaching capacity in practice took until the 1990s, when turbo codes appeared. We define \(C\) precisely in Lecture 6, where for a channel of bandwidth \(B\) and signal to noise ratio \(S/N\) it takes the celebrated Shannon and Hartley form \(C = B\log_2(1+S/N)\). For now, Lecture 1 lays the groundwork on the left-hand side of the inequality by measuring the information rate \(R\) that a source produces.
1.2 What is information?
Surprise as a measurable quantity
Consider a weather forecast of rain tomorrow in three places:
Rainforest, wet season — rain almost certain, so its announcement carries little information.
Somewhere in England — genuinely uncertain, so the answer carries a moderate amount of information.
Desert — rain is very rare, so its announcement would be a genuine shock and carries a lot of information.
The same three words, "it will rain", carry wildly different amounts of information. The rainforest forecast tells us almost nothing, because we knew it already. The desert forecast is a genuine shock. This is the central intuition: information is tied to uncertainty. The more unexpected an event is, meaning the smaller its probability, the more information its occurrence conveys. That single idea is the seed of the entire theory.
The digital source, formally
A generic digital source is described by four physical quantities:
Alphabet: The symbol set \(\{m_1, m_2, \ldots, m_q\}\) of possible messages.
Symbol probabilities: The values \(p_1, p_2, \ldots, p_q\) with \(\sum_i p_i = 1\).
Symbol rate: The value \(R_s\) in symbols per second.
Memory: The statistical dependence between symbols. A memoryless source has symbols that are independent of one another, and that is the case we study in this lecture. Sources with memory are the subject of Lecture 3.
Memory in everyday sources
Independent (memoryless)
Successive tosses of a fair coin.
Numbers drawn from a lottery machine with replacement.
Rolls of a die.
Knowing the last symbol tells you nothing about the next one, so there is no redundancy to remove.
Correlated (with memory)
Letters in English text, where a "q" is nearly always followed by a "u".
Consecutive video frames, which are almost identical.
Daily temperature, where today predicts tomorrow well.
Here the past helps predict the next symbol, so a coder can exploit that redundancy.
1.3 Information content of a symbol
Three requirements pin down the function
We want a function \(I(m_i)\) of a symbol's probability \(p_i\) that behaves the way our intuition demands. Three requirements pin it down:
Monotone in surprise: A smaller \(p_i\) should give a larger \(I\).
Certainty carries nothing: We need \(I = 0\) when \(p_i = 1\).
Additive for independent events: Two independent symbols occurring together, with probability \(p_i p_j\), should carry information \(I(m_i) + I(m_j)\). (A short proof that only the logarithm can satisfy this is given in the appendix.)
The additivity requirement is the decisive one. We need \(I(p_i p_j) = I(p_i) + I(p_j)\), that is, a function that turns products into sums. That is exactly the defining property of the logarithm, so \(I(p) \propto \log(1/p)\). Choosing base 2 fixes the unit as the bit:
This measure of information comes from Claude Shannon's 1948 paper "A Mathematical Theory of Communication," written at Bell Labs. Shannon considered several possible bases for the logarithm and chose base 2 because it matches the natural unit of a digital system, the binary digit. He credited the term "bit" itself to his colleague John Tukey, as a contraction of "binary digit." Base gives the same quantity in nats, and base 10 gives hartleys (or dits); all three are proportional to one another, so the choice of base only rescales the answer, never changes what it means.
The properties follow immediately from the graph of \(-\log_2 p\):
Since \(0 \le p_i \le 1\), we have \(I(m_i) \ge 0\), so information is never negative.
If \(p_i > p_j\), then \(I(m_i) < I(m_j)\), so rarer symbols carry more.
\(I(m_i) \to 0\) as \(p_i \to 1\), so a certain symbol carries no information.
\(I(m_i) \to \infty\) as \(p_i \to 0\), so a vanishingly rare symbol carries unbounded information, although it almost never occurs.
Figure 1.7. Information content rises without bound as a symbol becomes rarer, and falls to zero for a certain symbol.
1.3.1 Physical interpretation: bits as binary digits
Why "bits"? Because the information content of a symbol equals the smallest number of binary digits needed to label it, in the case where symbols are equally likely:
2 equally likely symbols \(\{0,1\}\): one binary digit each, and \(I = \log_2 2 = 1\) bit. ✓
4 equally likely symbols \(\{00,01,10,11\}\): two digits each, and \(I = \log_2 4 = 2\) bits. ✓
Assigning \(\log_2 q\) bits to every symbol is called Binary Coded Decimal (BCD). It is exactly right when symbols are equally likely. When they are not, it wastes bits, and fixing that waste is what the rest of Lectures 1 to 4 are about.
1.4 Entropy
Average information per symbol
A single symbol's information varies from one symbol to the next. What matters for system design is the average. Take a long sequence of \(N\) symbols from a memoryless source. Because the symbols are independent and \(N\) is large, symbol \(m_i\) appears about \(p_i N\) times.
Information from symbol \(m_i\) across the whole sequence. It occurs \(p_i N\) times, each occurrence worth \(I(m_i)\):
$$ I_i = (p_i N)\,\log_2\frac{1}{p_i} $$
(1.2)
Total information in the sequence, summed over the alphabet:
Entropy is a fundamental physical property of the source. It depends only on the alphabet and the probabilities, that is on quantities 1, 2 and 4, and not on the symbol rate. It answers a clear question: on average, how many bits of genuine information does each symbol carry?
Convention: 0 log 0 = 0
A symbol with \(p_i = 0\) never occurs, so it should contribute nothing to the average. Formally \(\lim_{p\to 0^+} p\log_2 p = 0\), so we define \(0\log_2 0 = 0\). This keeps \(H\) well behaved at the edges.
Units aside: bits, nats and hartleys
Everything above uses \(\log_2\), giving entropy in bits. Some derivations, including Problem 1.3 below, are easier in natural logarithms. The three common choices are related by a fixed scale factor:
In words: work in whichever base is algebraically convenient, then divide by \(\ln 2 \approx 0.693\) to convert nats back to bits. Base 10 gives a third unit, the hartley, used occasionally in older texts. All three describe the same physical quantity; only the ruler changes.
1.4.1 The binary source and maximum entropy
For a binary source with \(P(1)=p\) and \(P(0)=1-p\), the entropy is the binary entropy function:
$$ H(p) = -p\log_2 p - (1-p)\log_2(1-p) $$
(1.5)
Its shape is worth memorising. It is zero at both ends, because a biased coin that almost always lands the same way is predictable and so carries almost no information. It reaches a single maximum of exactly 1 bit at \(p = 0.5\), the fair coin, which is the point of greatest uncertainty.
Figure 1.8. Binary entropy H(p). Greatest uncertainty, and greatest information per symbol, occurs at the fair coin.
This generalises. For a \(q\)-ary source, entropy is greatest when all symbols are equally likely, so \(p_i = 1/q\) and \(H_{\max} = \log_2 q\). This gives the key bound, which we revisit throughout the module:
$$ 0 \;\le\; H \;\le\; \log_2 q $$
(1.6)
1.5 Information rate
From bits per symbol to bits per second
Entropy is measured per symbol. Multiply it by the symbol rate \(R_s\) to find how many bits of real information the source produces per second. This is the information rate:
$$ R \;=\; R_s \cdot H \qquad \text{(bits/second)} $$
Unlike entropy, the information rate depends on all four source quantities, because it includes \(R_s\). It is the true, irreducible demand of the source in bits per second, and it is the target that any good encoder tries to hit.
1.6 Why BCD wastes bandwidth
Sending more bits than you need
If we simply encode every symbol with \(\log_2 q\) bits, which is BCD, the source's output bit rate is:
$$ R_b = R_s \cdot \log_2 q $$
(1.7)
Since \(H \le \log_2 q\), it follows at once that
$$ R = R_s H \;\le\; R_s \log_2 q = R_b. $$
(1.8)
So the number of bits we actually send, \(R_b\), is generally larger than the number we truly need to send, \(R\). The gap \(R_b - R\) is pure waste. It matters because, as later lectures show, transmitting at \(R_b\) bits per second costs real resources, namely bandwidth and power. Squeezing \(R_b\) down toward \(R\) is the whole business of efficient source coding, the subject of Lecture 2, which covers Shannon and Fano coding and Huffman coding.
Coding efficiency (preview)
We measure how close a code comes to the ideal by its efficiency \(\eta = H / \bar{L}\), where \(\bar{L}\) is the average codeword length in bits per symbol. BCD gives \(\bar{L} = \log_2 q\), so \(\eta = H/\log_2 q \le 1\). The perfect entropy code reaches \(\eta = 1\), where \(\bar{L} = H\).
Worked examples
EXAMPLE 1.1 · Information content of a single symbol
A source emits four symbols with probabilities \(p_1 = \tfrac12,\ p_2 = \tfrac14,\ p_3 = \tfrac18,\ p_4 = \tfrac18\). Find the information content of each symbol.
The two rarest symbols each carry 3 bits, which is three times the information of the most common one. Notice that the probabilities are all negative powers of two, which is why the bit counts come out as whole numbers. That is exactly the case in which a code can be perfectly efficient.
EXAMPLE 1.2 · Entropy, information rate and BCD waste
The source of Example 1.1 emits at \(R_s = 1000\) symbols per second. Find (a) the entropy \(H\), (b) the information rate \(R\), (c) the BCD output bit rate \(R_b\), and (d) the coding efficiency of BCD.
1
Entropy
Weight each symbol's information by its probability:
BCD sends 2000 bits per second but only 1750 are needed, a waste of 12.5 percent. An ideal entropy code, using codewords of length 1, 2, 3 and 3 bits to match the information contents, would send exactly 1750 bits per second.
EXAMPLE 1.3 · Entropy of a biased binary source
A binary source has \(P(1) = 0.1\) and \(P(0) = 0.9\). Compute its entropy and compare it with a fair binary source.
A heavily biased coin carries only 0.47 bits per symbol, which is less than half the 1 bit of a fair coin. Because it is so predictable, a good code could represent this stream with well under one bit per symbol on average, whereas BCD would stubbornly use a full bit for each symbol. This is the gap that efficient coding exploits.
EXAMPLE 1.4 · English text, a real-world source
Treat English text as a 27-symbol memoryless source, the 26 letters plus space, all equally likely. What does BCD predict for the entropy, and how does this compare with the true entropy of English?
1
Equally likely letters
Under the equally likely assumption, the entropy is simply
But letters are not equally likely: "e" and "t" are common, "z" and "q" are rare. Using the real letter frequencies of English (still treating letters as independent) brings the entropy down to about 4.0 to 4.2 bits per letter.
3
Source memory
Once Shannon accounted for the correlation between neighbouring letters, that is, source memory, his celebrated estimate for English fell to roughly 1 to 1.5 bits per letter.
4
Other languages
The same estimates can be made for any written language. \(H_1\) uses single-letter frequencies only, \(H_2\) conditions each letter on the one before it, \(H_3\) on the two before it, "Real" is the entropy once long-range context (words, grammar, meaning) is included, and the redundancy \(1 - H_{\text{real}}/\log_2 N\) is the fraction of an equal-length encoding that an ideal code can remove. All values are in bits per symbol, rounded, and vary by a few tenths with the text corpus used.
Language
Symbols
log2 N
H1
H2
H3
Real
Redundancy
English
27
4.75
4.1
3.6
3.3
1.0 to 1.5
68 to 79%
Spanish
28
4.81
4.0
3.4
3.1
1.2 to 1.6
67 to 75%
Turkish
30
4.91
4.3
3.6
3.2
1.3 to 1.8
63 to 74%
Arabic
29
4.86
4.2
3.4
3.0
1.4 to 1.9
61 to 71%
Chinese
about 7,000 characters
12.8
9.6
6.8
5.5
4 to 5.5
57 to 69%
The four alphabetic languages behave almost identically: about 4.8 bits for equally likely symbols, falling to roughly 4 bits with letter frequencies, about 3 bits with two letters of context, and below 2 bits with full context. Turkish starts slightly higher because it has more letters and its words are long chains of suffixes. Arabic falls quickly because short vowels are normally not written, so each written letter is less predictable from frequency alone but strongly constrained by its neighbours.
Chinese is different because its symbols are not letters. Written Chinese is logographic: each character stands for a syllable and usually a whole unit of meaning (a morpheme), and everyday text draws on several thousand distinct characters. A larger alphabet gives a larger \(\log_2 N\), and each character carries far more information than one letter, about as much as two or three letters of English. The fair comparison is therefore per unit of meaning, not per symbol. Measured per word or per sentence of the same content, Chinese and English carry similar amounts of information; Chinese simply packs it into fewer, richer symbols.
The gap between 4.75 bits (BCD) and about 1.3 bits (real English) is enormous: it is the same gap this lecture keeps returning to, and it is why English text compresses so well. Lecture 2 builds codes that recover some of that gap for independent symbols, and Lecture 3 shows how source memory recovers the rest.
MATLAB corner
Three short scripts make the ideas concrete: a reusable entropy function, a plot of the binary entropy curve so you can see the peak at \(p = 0.5\) for yourself, and a real-data check using English letter frequencies.
entropy_bits.m
MATLAB
% Entropy (bits/symbol) of a discrete memoryless source.
% p : vector of symbol probabilities (must sum to 1).
function H = entropy_bits(p)
p = p(p > 0); % drop zeros: 0*log2(0) := 0
if abs(sum(p) - 1) > 1e-9
warning('Probabilities do not sum to 1.');
end
H = -sum(p .* log2(p));
end
% --- Example 1.2 check ---
p = [1/2 1/4 1/8 1/8];
H = entropy_bits(p) % H = 1.7500
Rs = 1000; R = Rs * H % R = 1750 bits/s
Rb = Rs * log2(numel(p)) % Rb = 2000 bits/s
eff = H / log2(numel(p)) % eff = 0.8750
binary_entropy_plot.m
MATLAB
% Binary entropy function H(p) = -p*log2(p) - (1-p)*log2(1-p)
p = linspace(0, 1, 501);
H = -p.*log2(p) - (1-p).*log2(1-p);
H(isnan(H)) = 0; % fix the endpoints p = 0, 1
plot(p, H, 'LineWidth', 2); grid on
xlabel('P(1) = p'); ylabel('H(p) [bits/symbol]');
title('Binary entropy function');
[Hmax, k] = max(H);
fprintf('Peak H = %.3f bit at p = %.2f\n', Hmax, p(k));
% Peak H = 1.000 bit at p = 0.50
english_letter_entropy.m
MATLAB
% Entropy of English text from single-letter frequencies
% (a classic unigram table, percent occurrence, order ETAOIN...).
fprintf('English (unigram): %.2f bits/letter vs BCD %.2f bits/letter\n', H, Hmax);
% English (unigram): 4.17 bits/letter vs BCD 4.70 bits/letter
Problems with solutions
Work each one before reading the solution.
PROBLEM 1.1
A fair die with six faces is rolled and the outcome transmitted. (a) How much information does one roll convey? (b) If rolls occur at 4 per second, what is the information rate? (c) How many bits does BCD use per roll, and what is its efficiency?
Solution. All six faces are equally likely, so \(p_i = 1/6\). (a) The entropy equals \(\log_2 6 = 2.585\) bits per roll. (b) The information rate is \(R = R_s H = 4 \times 2.585 = 10.34\) bits per second. (c) BCD needs \(\lceil\log_2 6\rceil = 3\) bits per symbol, since we cannot send a fractional bit per symbol, so \(\eta = 2.585/3 = 0.862\), or 86.2 percent. Notice that the ideal value \(\log_2 6\) is not an integer, so even a good code cannot reach full efficiency one symbol at a time. Coding several rolls together as a block closes the gap.
PROBLEM 1.2
A source has alphabet \(\{A,B,C,D\}\) with probabilities \(0.5, 0.25, 0.125, 0.125\). (a) Find \(H\). (b) A student claims that because there are four symbols, you always need 2 bits each. Explain precisely why this is wasteful and state the best achievable average length.
(b) The student is describing BCD, which uses \(\log_2 4 = 2\) bits per symbol whatever the probabilities. But the symbols are not equally likely. The common symbol \(A\) deserves a short codeword, and the rare symbols \(C\) and \(D\) deserve longer ones. Assigning lengths equal to the information contents, namely 1, 2, 3 and 3 bits for \(A, B, C, D\), gives an average length \(\bar L = 0.5(1)+0.25(2)+0.125(3)+0.125(3) = 1.75\) bits per symbol, which equals \(H\). That is the best achievable, with \(\eta = 100\) percent, whereas the 2 bits per symbol of BCD is 12.5 percent worse. Lecture 2 shows that Huffman coding constructs exactly such a code.
PROBLEM 1.3
Show from the definition that the entropy of any \(q\)-ary source satisfies \(H \le \log_2 q\), with equality only when all symbols are equally likely. Use the inequality \(\ln x \le x-1\).
Solution. The idea is to study the sign of the difference \(H - \log_2 q\) and show it can never be positive. We use the standard bound \(\ln x \le x - 1\), which holds for all \(x > 0\) with equality only at \(x = 1\).
Step 1. Write \(\log_2 q\) as a weighted sum. Because the probabilities sum to one, \(\sum_i p_i = 1\), we may attach \(\log_2 q\) to that sum:
Step 6. Equality condition. The single inequality we used, \(\ln x \le x - 1\), is tight only at \(x = 1\). Here \(x = \dfrac{1}{q\,p_i}\), so equality requires \(\dfrac{1}{q\,p_i} = 1\), that is \(p_i = \dfrac{1}{q}\) for every \(i\). In words, entropy attains its maximum \(\log_2 q\) exactly for the equally likely (uniform) source, and a quick check confirms it: with \(p_i = 1/q\), \(H = \sum_i \tfrac1q \log_2 q = \log_2 q\). This is precisely why BCD, which spends \(\log_2 q\) bits per symbol, is efficient only when the symbols are equally likely.
Summary and key formulas
Information content of a symbol
$$I(m_i) = -\log_2 p_i$$
Entropy (average info per symbol)
$$H = -\sum_{i} p_i\log_2 p_i$$
Information rate
$$R = R_s\,H$$
Entropy bound and BCD
$$H \le \log_2 q = R_b/R_s$$
Information measures surprise. Rarer symbols carry more, and the unit is the bit.
Entropy is the average information per symbol, a fundamental property of the source that does not depend on the symbol rate.
Information rate \(R = R_sH\) is the true number of bits per second the source must send.
BCD spends \(\log_2 q\) bits per symbol and is optimal only for equally likely sources. In general \(R_b \ge R\), which leaves room for efficient coding.
Next, in Lecture 2: maximum entropy, and building efficient codes with the Shannon and Fano method and Huffman coding, which push \(\bar L\) down toward \(H\).
Appendix: why the logarithm?
Section 3 asked for a function \(I(p)\) with three properties: it decreases as \(p\) increases, it vanishes at \(p=1\), and it is additive, \(I(p_ip_j) = I(p_i) + I(p_j)\), for independent events. Here we show the additivity condition alone, together with the mildest smoothness assumption, forces \(I\) to be a constant multiple of \(\log(1/p)\).
Step 1. Restate additivity as a functional equation. Write \(f(p) = I(p)\) for \(p \in (0,1]\). The requirement is
$$ f(xy) = f(x) + f(y) \qquad \text{for all } x, y \in (0,1]. $$
Step 2. Substitute \(x = y\). Then \(f(x^2) = 2f(x)\), and by induction \(f(x^n) = nf(x)\) for every positive integer \(n\). Applying this with \(x\) replaced by \(x^{1/n}\) gives \(f(x) = n f(x^{1/n})\), so also \(f(x^{m/n}) = \tfrac{m}{n} f(x)\) for positive integers \(m, n\). So \(f(x^r) = r f(x)\) for every positive rational \(r\), and by continuity (our smoothness assumption) for every real \(r > 0\).
Step 3. Fix a reference point. Pick any \(x_0 \in (0,1)\) and define the constant \(c = f(x_0)/\ln(1/x_0) > 0\) (positive because \(f\) decreases and \(\ln(1/x_0) > 0\)). For any other \(p \in (0,1)\) write \(p = x_0^r\) for \(r = \ln p / \ln x_0\). Then by Step 2:
$$ f(p) = f(x_0^r) = r f(x_0) = \frac{\ln p}{\ln x_0} \cdot c\ln\frac{1}{x_0} = -c\ln p = c\ln\frac{1}{p}. $$
Step 4. Conclude. So \(f(p) = c\ln(1/p)\) for some positive constant \(c\), that is, \(I(p)\) must be a constant multiple of a logarithm of \(1/p\), in any base. Choosing \(c = 1/\ln 2\) turns the constant into \(\log_2\) and fixes the unit as the bit:
No other family of functions, polynomial, exponential, or otherwise, satisfies the additivity requirement. The logarithm is not a convenient modelling choice; it is the only function the axioms allow.